|
WHEN
YOU SEE a logging truck on the road and realize that someone's
trees have just been cut, do you wonder how much logging has
gone on countywide over time? What is the bigger picture? Does
anyone actually keep records?
Yes,
there are records, but they are hard to retrieve. By rooting
around major libraries and state agencies, I have turned up seemingly-accurate
harvest records for the past 50 years. Additional data, not included
here, can extend harvest volumes back to 1925.
Without
hard data, opinions about the social, economic and ecological
consequences of timber harvesting will remain just that - opinions.
What follows is some of the fundamental information that must
be incorporated into a rational dialogue regarding our forests.
HARVESTS GO IN CYCLES
HOW
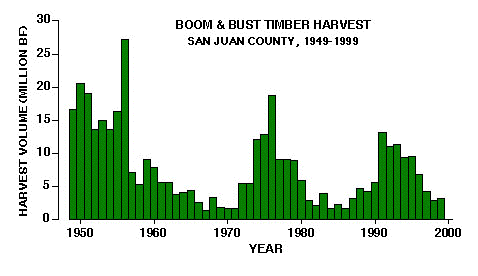
MUCH TIMBER is cut and sold each year in the San Juans? As the
following graph shows, harvest volumes for the last half century
have fluctuated cyclically. Three periods of heavy logging (1950s,
mid-1970s and early 1990s) were separated by slumps in activity.
In the late 1990s we entered a period of relative "bust,"
mostly due to temporarily depressed log prices and slow Asian
markets.
The
first "boom" coincided with the post-WWII expansion
in home construction market. Indeed, earlier records going back
to 1925 (not included here) show that logging was very low, except
for a one-year spike in 1934, until the end of the war. Logging
prior to 1925 was probably fairly heavy in cetain regions to
generate fuelwood for lime kilns, other commercial uses, and
domestic use, as will be explored in another page dealing with
forest history.
The
recent boom of the early 1990s coincided with major shifts in
timber availability regionwide due to federal spotted-owl policy.
Limited cutting in national forests created sharply rising log
prices that peaked around 1995 and the demand sought out timber
in vulnerable (or willing) private forestland holdings throughout
the state, including San Juan County, where essentially all of
the forests are privately owned.
Damaging
windstorms of late 1989 and early 1991 in this county also stimulated
high volumes of harvesting in the very early 1990s. The amount
of downed timber exceeded the capacity of local logging operators
at the time so many gyppo loggers came into the islands for the
salvage work. An inflated workforce, combined with the dramatically
panicked landowners and tempting log prices, precipitated a circus
of opportunistic cutting that far exceeded salvage harvests.
In the frenzy many landowners and forest sites were abused, as
will be examined in greater detail on another page devoted to
nuances of logging activity during the 1990s.
Regarding
the data in the above graph, harvest volume is reported in board
feet, not trees. How many board feet are there in a tree? Of
course, it depends. One useful rule-of-thumb conversion is the
volume commonly carried by a loaded logging truck: in our setting,
a loaded truck conventionally carries 3000-4000 board feet of
logs, say about 3,250 board feet on average. Accordingly, if
10 million board feet are cut and sold from San Juan County in
a given year, about 3000 truck loads are transported to out-of-county
mills and dealers. That's ten trucks every working day! (For
a variety of reasons, many logs are actually transported by raft
or barge, in addition to logging trucks, but full logging trucks
are easily recognized on the ferries, especially on the low-traffic
runs, when, coincidentally, they are less observed.)
HARVEST ACREAGE
THE
AMOUNT OF forestland acreage subjected to timber harvesting has
also been recorded. Once again, the data show peaks and troughs
of activity, without clear distinction between clearcuts or partial-cut
harvests.
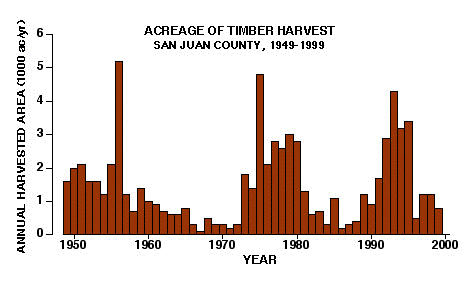
The
above chart shows peaks of a couple thousand acres harvested
each year. Is 2000 acres of logging in a year a lot? Is it too
much? Well, relative to what?
The
San Juans have a total of 70,000 acres of forestland - 60,000
acres in private ownership, where virtually all of the logging
occurs - so 2000 acres cut in a single year is more than 3% of
the overall resource. This rate of cutting is many times greater
than the rate of local timber growth, which is exceptionally
slow relative to other parts of Washington (see "productivity"
below). The many aspects of local timber productivity will be
expanded in a later page.
SHRINKING HARVEST YIELDS - ARE THE TREES
SMALLER NOW?
THE
BEST WAY to see what is happening in a forest is to take an informed
look at the plant community itself, especially the trees. But
getting the historical, countywide picture presents special problems
that field work alone can't solve. Fortunately, there is an analytical
approach which uses the 50-year harvest stats shown above. So,
leave your boots by the door for a while and carry out the following
simple calculation. The result may be disturbing.
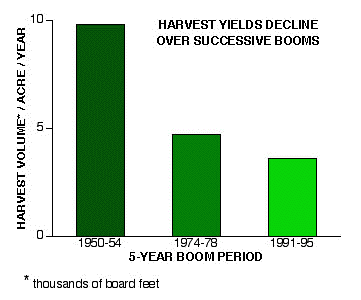
A
given year's harvest yield is calculated by dividing
its harvest volume by its harvest acreage; this gives the yield
in board feet per acre that was extracted in that year. By comparing
5-year average annual yields during the three boom harvest periods,
there is a progressive and obvious decline.
The
harvest yield in the 1990s was only about one-third what it had
been in the 1950s. This strongly suggests that trees harvested
from our forests are getting dramatically smaller. After all,
logging in San Juan County has always focused on removing the
most marketable trees, i.e. "taking the biggest and
best, and leaving the rest." It is well known in forestry
that the predictable consequences of repeated "high-grading"
is progressive forest decline. And that is what seems to be going
on in San Juan County. The present rate of harvest in the San
Juans is evidently excessive; wood is being removed from the
forests faster than it is being replaced through growth.
LONG-TERM RATE OF HARVEST
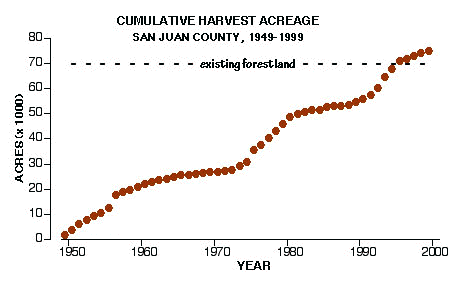
ANOTHER
WAY TO look at the rate of cutting is to plot the acreage data
cumulatively. The chart below shows that harvesting has advanced
through 75,000 acres of forestland since 1949. That is, in a
span of merely 45 years an area equivalent to the entire forested
landscape, which is 70,000 acres, has been cut. (Virtually all
cutting has occurred on the 60,000 acres of private forestland.)
What are the consequences of cutting-over the county's forests
in a mere 45 years?
Remember
that lots of logging went on in the San Juans prior to 1950 when
the presented data begin. It began seriously in about 1890 and
continued with a vengeance up to about 1930, by which time most
of the pre-settlement forest in the county had been cutover (though
not necessarily clearcut by today's standards). After a slowdown
with the Depression and the War, logging began in earnest in
the last years of the 1940s. So most likely the above chart represents,
on average, the second time the forest has been cut.
The
amount of time between cycles of cutting, regeneration and regrowth
of mature trees, and then subsequent cutting of a forest stand
is called the "rotation time." A rotation as short
as 45 years is highly unusual anywhere in Washington.;45-year
rotations are sometimes practiced by the most intensively managed
industrial tree farms located on the most highly productive timber
growing sites of the Cascade foothills; but anywhere else, such
short rotations are prima facie evidence of forest destruction.
It is common sense: just how much can a tree grow in 45 years,
especially where tree growth is slow (see below) and what is
the overall average condition of a landscape that is cut so frequently?
Obviously,
the forests of San Juan County still exist today, despite the
above cumulative harvest acreage during the past 50 years. This
seeming contradiction dissolves because partial cutting, rather
than clearcutting, has become the common standard here (except,
of course, for ~1-acre home-site clearings and certain other
cases). Partial cutting always leaves some trees behind, even
though the usual - and imprudent - practice is to remove the
economically (and ecologically) most valuable trees and leave
the lesser ones. Thus, the concept of rotation doesn't quite
pertain in ten San Juans; essentially every acre of our forests
may indeed have been harvested twice since 1890, but only partially
harvested. To the undiscerning eye, therefore, we seem able to
eat our cake and yet still have it too. The real question, however,
is what the meaning of "it" is.... What kind of forest
remains after high-grade logging?
A REGIONAL VIEW OF PRODUCTIVITY
RELATIVELY
SHORT ROTATIONS (i.e., time between cuts) are arguably sustainable
in regions where timber productivity is sensationally high. How
do timber-growing conditions in the San Juans compare with others
in Washington state: are ours sensational, average, or mediocre?
An answers to this question may lend meaning to the high rates
of harvest, high extent of harvest, and short rotation cycles
reported above. Is San Juan County bonanza timber-growing country
or does our rate of cutting exceed our forest's capacity to re-grow
trees?
Many
people have heard that trees grow more slowly here than in some
other places in Washington, but how have the experts actually
quantified our timber productivity? (The term "timber productivity"
refers to the peak potential for growth in a hypothetical mature
stand and is based on local growing conditions, which in turn
defined "land grades." This peak rate of growth occurs
at a characteristic age, i.e., at "culmination.")
The following chart puts San Juan County's timber productivity
into a region-wide perspective and can be read like a report
card of potential timber productivity. Our county gets the
only "poor" grade in Western Washington! Its timber
productivity is the absolute lowest.
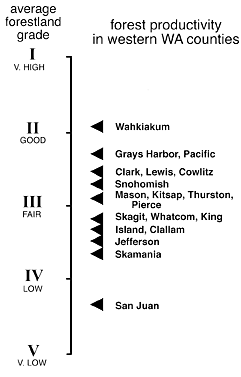
The
comparative chart above shows that San Juan County's forest productivity
is by far the lowest in western Washington. Our trees grow substantially
slower than elsewhere. The average land grade is between IV and
V, which means that timber growth is severely limited by soil
and climatic conditions. (Land grades in the county actually
range locally between III and V; the geographic distribution
of productivity grades will be explored more fully in another
report.)
Low
timber productivity in San Juan County means that, even at culmination,
the rate of volume growth is low. Culmination - the age at maximum
timber growth - is also relatively delayed compared to more productive
areas. In this county's forests culmination is at 100-120 years,
whereas in forests on "good" land of grade II culmination
is at about 50 years. For sustainability, age at culmination
should be matched to rotation of timber harvesting, so it follows that San
Juan's forests are being harvested 2 to 3 times too rapidly (turning
over ever 45 years vs 100-120 years).
From
this comparison of timber productivity, we should become very
vigilant of the trends in timber harvesting in San Juan County.
Our forestry practices seem to be way out of balance with our
local limitations. Our forests are being cut at an exceptional
rate and in a destructive manner that is neither sensible nor
prudent. Furthermore, since timber productivity here is instrinsicaly
so diminished, regrowth after harvesting is unusually slow, which
means that the visual and ecological consequence of harvesting
will persist much longer than elsewhere.
So,
if we want to retain our forests, let alone to incease the quality
of our forests for the future, our harvesting practices need
to be geared to local realities, not simply to expediency, short-term
profitability, or mainland standards.
REFERENCES AND NOTES
1. 50-year harvest volume
and acreage: 1949-86, Washington Timber Harvest Annual Reports,
Washington Dept. of Natural Resources (harvest volume and acreage);
1987-94, Washington Timber Harvest Annual Reports (timber volume
only); 1988-99, Forest Tax Reports, Washington Dept. of Revenue
(volume only);1987-1999, Forest Practices Applications for San
Juan County, Washington Dept. of Natural Resources (projected
volume and acreage).
2. Productivity: Averaging
land grades over large areas is unconventional and problematical.
To prepare this chart, overall county average land grades were
determined by averaging acreage-weighted land grades based on
acreages and grade designations from Washington Department of
Natural Resouces.
Return to fOREST iNFO Home
Tom Schroeder
tom@rockisland.com
|


